Let’s trace the hints and check the file. You’ve got to hand it to the U.S. stock market. The U.S. Federal Reserve keeps throwing monetary policy haymakers, and the S&P 500 takes the hits in stride. The cooling of inflationary pressures has ground to a halt, and in some respects pricing pressures are reaccelerating, yet U.S. stocks are largely unfazed. And the U.S. economy remains relentlessly strong, further fueling the inflationary inferno that has been ablaze for more than two years now, and stocks cannot help but to see the positives despite already historically high valuations.
You may hate on the stock market with countless reasons why it should be trading lower, but we don’t get to trade the market we think we should have. The stock market is going to do what it wants to do at any given point in time for reasons that sometimes may be difficult to see. Respecting this market capriciousness by maintaining and strategically managing a dedicated equity allocation regardless of the broader economic environment is key in the portfolio management process. And assessing the technical characteristics of not only the U.S. stock market but other key asset classes in a broader asset allocation can be useful in determining what to expect from your dedicated strategy going forward.
Let’s see who bit to detect the style. The consensus view was short-term negative heading into 2023, but the light at the end of the tunnel was getting brighter. The S&P 500 was already solidly in bear market territory, yet the Fed was still expected to raise interest rates a couple more times before finally topping out after its March meeting. Although the rapid pace of rate hikes delivered by the Fed over the past year were expected to push the U.S. economy into recession by the middle of 2023, the fact that inflation pressures were coming back down at an accelerating rate meant that forward looking investors could increasingly look through any mid-year slowdown to the lower interest rates and reaccelerating economic growth that would likely follow by the end of the year.
Just over two months into the New Year, and the underlying market script has shifted dramatically. Instead of a quarter point hike in February and March before calling it a monetary policy tightening cycle, the Fed is now expected to reaccelerate its rate hiking ways with a half point hike in March followed by at least another quarter point in both May and June and a 50/50 chance for yet one more rate hike in July. Put simply, instead of getting a half percentage point in rate hikes from the Fed, we’re now looking at least another one percentage point of hiking if not more before it’s all said and done. This renewed hawkishness is, of course, in response to stubbornly high inflation and a persistently strong economy. And the likely result of these shifts is an economy that may go into recession a bit later but last longer and go deeper than originally anticipated at the start of the year. In short, the light at the end of the tunnel is suddenly much further away than previously perceived.
Stocks should be hating this outcome. Frankly, same with long-term bonds and gold. After all, the strong bear market rallies in stocks we witnessed first from June to August 2022 and then from October 2022 to the present were supposedly built on the notion that the U.S. Federal Reserve is almost done with rate hikes and that a reversal to rate cuts would follow not long after. Yeah, turns out not so much at all.
Instead, although stocks as are still well below early 2022 highs and have surrendered some ground over the past month or so, the S&P 500 remains in a steady uptrend dating back to before Halloween. Long-term U.S. Treasuries are also still on the mend over this same time period. And while gold has been more of a sideways trader for the last few years, its surge from its early November lows remains significant. While none of these investment category outcomes is what would be reasonably expected given developments in the broader economy, don’t sweat the technique.
Scientists try to solve the context. So why exactly are stocks, bonds, and gold all largely holding their ground despite the deluge of negative developments from an economic and monetary policy perspective?
First, it is important to remember that a good deal of value had already been washed out of the stock and bond market over the past year. The only problem with leaning too heavily on this point of comfort is that stock valuations remain historically high and bond yields are still well below the stubbornly high inflation rate.
Another is that while the pace of economic activity is moderating, it is doing so from levels that are still particularly strong. In other words, the rapid pace of monetary tightening that has taken place over the past year has done little to meaningfully slow economic activity. This has played a part in keeping corporate earnings higher than might have otherwise been anticipated to date.
Lastly and perhaps most importantly, the underlying liquidity environment remains relatively abundant. For example, while the Fed’s balance sheet and the real M2 money stock are contracting, they remain at totals that are still miles above pre-COVID levels.
Philosophers are wondering what’s next. While it remains to be seen whether stocks, bonds, and gold can continue their recent winning ways, the trend remains definitively to the upside for many of these categories.
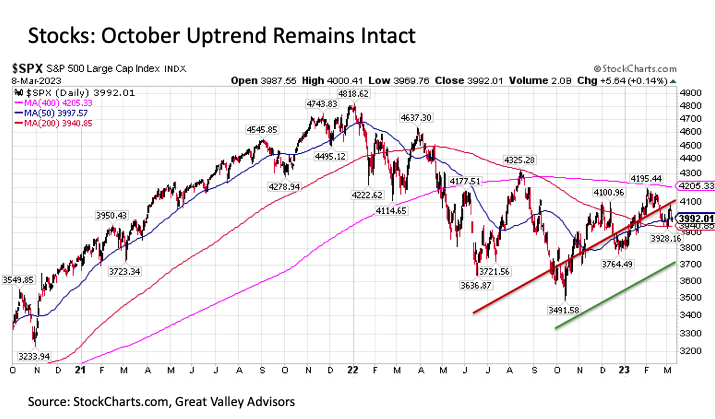
Let’s begin with stocks. The recent uptrend in stocks dating back nearly five months to last October remains very much intact today. Perhaps even more notably, the S&P 500 continues to steadily trade above its long-term 200-day moving average (red line in chart above) after breaking back above in January. The longer that stocks can hold their ground above this key technical level, the more they are likely to keep the upward momentum going into the future and that the worst of the bear market may be behind us. A further advance above the 400-day moving average (pink line in chart above) would provide a powerful added signal in this regard.
Putting this together, a key level to watch for stocks in the days ahead on the S&P 500 is around 3940, which is where the benchmark index has been flattening after sloping consistently downward since April of last year. If the S&P 500 can hold above this level, this is decidedly bullish. Moreover, a breakout above 4200 on any upside rally is even more constructive. And the fact that stocks were able to do so in an environment where so much challenging economic news has been thrown at them in recent weeks would be all the more of a signal of the resilience of positive investor sentiment in the current environment.
In predicting the stock market outlook, it is also useful to consider the performance of other asset classes that have meaningfully influence stocks. The Treasury market is leading among these. Although U.S. stocks and long-term Treasuries have a low correlation to negative correlation from a returns perspective over time (except of course during a high inflation driven stock bear market, where the correlations become higher as both move to the downside as we saw in 2022), Treasury yields are instrumental for stocks since the interest rate investors are being paid on their bond investments has a meaningful effect on the equity risk premium and earnings yield that investors require to own stocks.
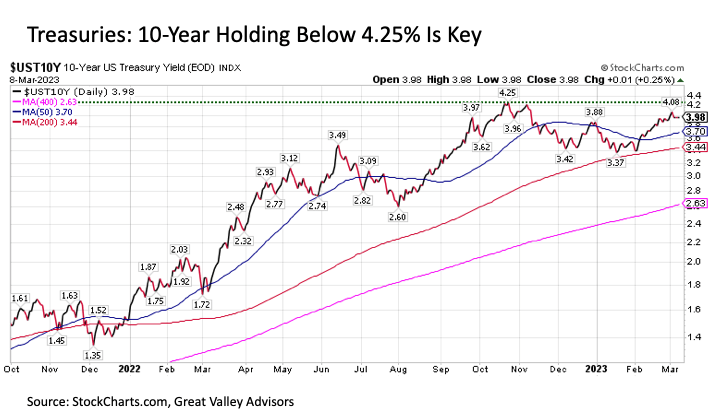
After rising dramatically since the start of last year, U.S. Treasury yield have been holding a top first set back in October. While inflation pressures have been reaccelerating as of late, the 10-Year U.S. Treasury yield continues to hold just below 4.00%, which is more than 25 basis points below its 4.25% high from mid-October. Although it has yet to break back below its 200-day moving average (red line in the chart above), if the 10-Year can hold at or below 4.25% in the coming weeks, this is a constructive signal not only for Treasuries but also for stocks, as it would increasingly imply that peak Treasury rates are now in.
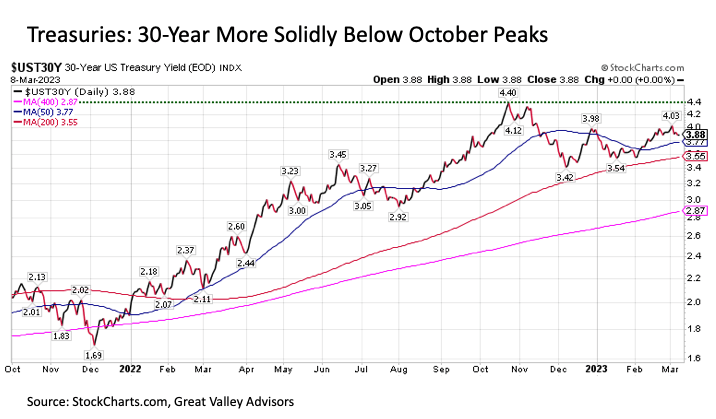
Just as we might consider the performance of U.S. small and mid-caps or non-U.S. stocks as a signal for what to expect for the S&P 500 Index, so too is it worthwhile to consider other segments of the Treasury yield curve to signal what we might expect from the benchmark 10-Year U.S. Treasury yield. For example, it is worth noting that while the 10-Year is around 25 basis points below its October peak, the 30-Year U.S. Treasury is more comfortably below its peak from around the same time at more than 50 basis points. While a distinct move below its 200-day moving average would also be a positive confirmation signal, this implies added support for the 10-Year Treasury yield holding its ground as well as for stocks.
Gold is yet another low to negatively correlated asset class to consider in relation to expected stock performance. While the yellow metal is widely regarded as an inflation hedge, it is even more so a signal of anticipated aggressiveness of global monetary policy makers and their ability to keep inflationary pressures under control. Put more simply, if gold is surging to the upside, investors are likely either concerned about economic/market instability or that the Fed is being too soft in combatting inflation. Conversely, if gold is careening to the downside, either the economic/market environment is simply too good and stable for investors to want to consider alternative allocations, which is not the case right now, or that global central banks are poised to tighten monetary policy aggressively to combat spiraling inflation. The latter was certainly the case for much of 2022, but since October we have seen notably greater optimism in this regard signaled by the gold market rallying strongly from its lows.
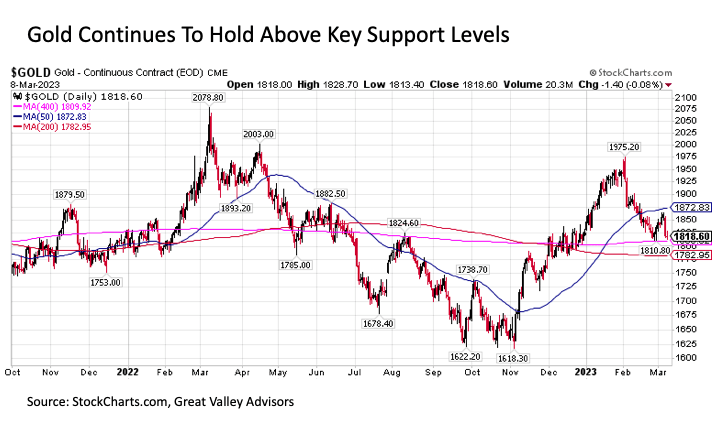
While gold has surrendered meaningful ground since the start of February when inflation concerns reignited, the fact that it is holding its ground not only above its 200-day moving average (red line below) but also its 400-day moving average (pink line below) is a constructive sign that the worst in the inflation battle may now be behind us. A key will be gold holding these two moving average support levels at around $1780 and $1810 per ounce, respectively, in the coming days and weeks.
Classical too intelligent to be radical. The U.S. stock market and the key asset classes that surround it also warrant investor respect for another important reason. Investors have been at this game for a very long time dating back to before the advent of the Fed put in ’86 and the birth of Thelonious Monk more than a century ago.
The wealth of historical data at our disposal to support our present-day decision making is vast. Not only can policy makers find direction in how markets have responded to past economic events, but investors can also be guided by how markets have navigated these various past episodes. This is not our first time making our way through a generally well behaved bear market in U.S. stocks, and it likely won’t be our last. While markets movements at any given point in time may appear radical, remain dedicated to your classical long-term investment philosophy, make intelligent adjustments at the portfolio margins as needed, and respect the markets and their movements as events unfold along the way.
Disclosure: I/we have no stock, option or similar derivative position in any of the companies mentioned, and no plans to initiate any such positions within the next 72 hours. I wrote this article myself, and it expresses my own opinions. I am not receiving compensation for it. I have no business relationship with any company whose stock is mentioned in this article.
Additional disclosure: Investment advice offered through Great Valley Advisor Group (GVA), a Registered Investment Advisor. Great Valley Advisor Group and Stonebridge Wealth Management are separate entities.
This is not intended to be used as tax or legal advice. Please consult a tax or legal professional for specific information and advice. Third party posts found on this profile do not reflect the views of GVA and have not been reviewed by GVA as to accuracy or completeness.