“Well we all need someone to lean on and if you want it, well you can lean on me”
–Let It Bleed, Rolling Stones, 1969
It has been a difficult past four weeks since late October through late November for the U.S. stock market. After hitting new all-time highs less than 80 points shy of the 7000 mark back on October 29, the S&P 500 has been steady decline since, having dropped by more than -5.7% through last Friday. This recent decline has raised concerns among investors that the high-flying AI “bubble” may have finally hit a wall and that it may be time to turn an eye toward the stock market exits. While I’m certainly no stranger to bearish sentiments about the intermediate-term to long-term stock market outlook, investors should caution about overreacting to any stock pullback that is taking place in the near-term today.
Lean on. It’s never pleasant to watch stock prices move sustainably to the downside. But it’s important to remember that stock prices historically almost never move uniformly in one direction, whether it be to the upside, or the downside, at any given point in time. Instead, it almost always oscillates as it moves in any given direction over time. And the recent pullback since October should be viewed as nothing more than the latest “step back” in what has been arguably way too many uninterrupted “steps forward” dating back to late April. In short, stocks were loooooong overdue for a pullback as we readied our bowls of candy for Halloween, and the long overdue pullback we are now experiencing. The following is an excerpt from my recent GVA Economic & Market Update from right around the time of the market peak on October 31.
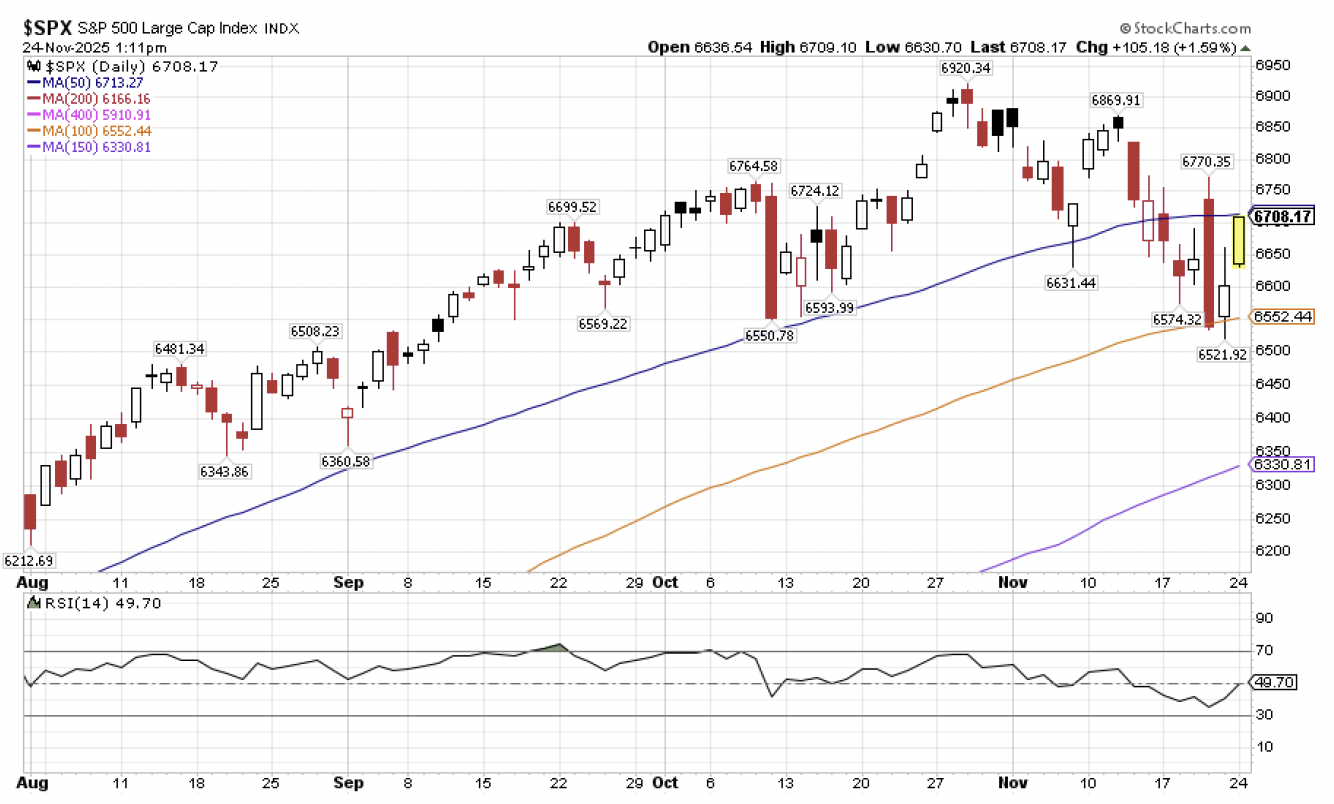
The S&P 500 is trading as much as +12% above its previous all-time highs set in February just before the tariff induced cascade to the downside. As it stands today, the S&P 500 is trading 3% above its medium-term 50-day moving average (blue line). It’s trading 12% above its long-term 200-day moving average (red line). And it’s floating 16% above its ultra long-term 400-day moving average (pink line). Put simply, we are overdue for a sustained correction if not an extended period of consolidation. And we should not be at all surprised to see the S&P 500 drop by more than 1000 points over a one to three month period from its recent all-time highs, and it would represent nothing more than garden variety mean reversion as part of a continued long-term uptrend dating back more than three years now.
So where do we stand today? We are now four weeks, or just less than one month, into a pullback that has seen the S&P 500 fall by -5.7% peak to trough. And as also mentioned in previous Market Updates, a -5% to -12% correction over a four to twelve week period is something that we’ve seen over and over again throughout market history where froth comes off the top of the market as part of a healthy “one step back” reset before stocks take their next “three steps forward”. As a result, we could see another six percentage points come off of this market through early next year, and the uptrend would very likely still be fully intact.
Dream on. So where do we stand today? I don’t think we will see six additional percentage points come off this market through early next year. Instead, I would contend that the four week pullback we’ve seen since late October may be close to over if it’s not finished already. Consider the chart below. Regular readers are familiar with the medium-term 50-day moving average (blue line), long-term 200-day moving average (red line), and ultra long-term 400-day moving average (pink line) that I regularly cite as support/resistance trendlines for the stock market over time. But there are two other lines that I also roll out occasionally for times like today. These are the medium-term 100-day moving average (orange line) and the “smoothing mechanism” medium-to-long-term 150-day moving average (purple line). Often, when the S&P 500 breaks support at its medium-term 50-day moving average as it has over the past week, it will find support at its 100-day or 150-day moving average instead of making the sometimes long trip all the way down to the 200-day moving average.

Such is what appears to be formulating today. Let’s Zoom in to take a closer look.

The S&P 500 landed on its 100-day moving average (orange line) to close out the trading day last Thursday. It opened on this same line on Friday, tried to make a push below it during the trading day, failed, and marched its way back higher to close above this support line to close out the week. What have we seen so far during Monday’s trading? The S&P 500 is making a run at breaking back above its 50-day moving average support line, which I’m not yet ready to declare is resistance (you’ve got to spend a length of time longer than what it takes for milk to go bad in your fridge before you can declare that a previous support line is broken). Put simply, if the S&P 500 breaks out above 6715 between now and Thanksgiving (this will also require the Relative Strength Index (RSI) to advance back above 50), it’s very likely game on back to the upside and we can return to shopping for our S&P 500 “7000+ Go Like Hell” signs to hide behind the Christmas tree.
Cue 10/31 Market Update reprise

Conversely, it is very possible that this Chief Market Strategist is dead wrong and we extend this current pullback into a full-blown correction (down -10%) over the coming weeks before it’s all said and done. If so, we then will refer to the 150-day (purple line) and 200-day (red line) moving averages currently at 6330 (down -8.5% from October peak) and 6166 (down -10.9% from October peak), respectively, for the next levels of support to watch. but even if we fall that far (and it’s important to note that these lines are steadily rising), that we’d still be well within our historical “garden variety” pullback, uptrend still intact range.
Feed on. So why is this Chief Market Strategist that has been espousing his bearishness in recent GVA Economic & Market Updates suddenly sounding so bullish now that we are in the midst of a pullback? Because it’s all a matter of timing. I continue to contend that things could get dicey for the U.S. stock market as we make our way through 2026. But it’s not 2026 yet. And stuff has to happen between now and sometime in 2026 before I’m ready to declare that potential bearishness is something that may actually happen and we may need to adjust portfolios at the margins to do something about (we may not need to adjust either – as I always like to say, a well-constructed asset allocation portfolio is one that is positioned in advance for different potential market outcomes). Put simply, this is a 2026 problem to worry about. In the meantime, the market continues to provide a feast of reasons to remain bullish as we put the institutional trading season behind us (effectively ended last Friday) and retailer traders take over to potentially rally this market hard into the end of the year. Predictions of 7000 by the end of 2025 and 7200 by January/February 2026 are still in place from this Chief Market Strategist.
Three key fundamental reasons support this continued short-term bullish view.
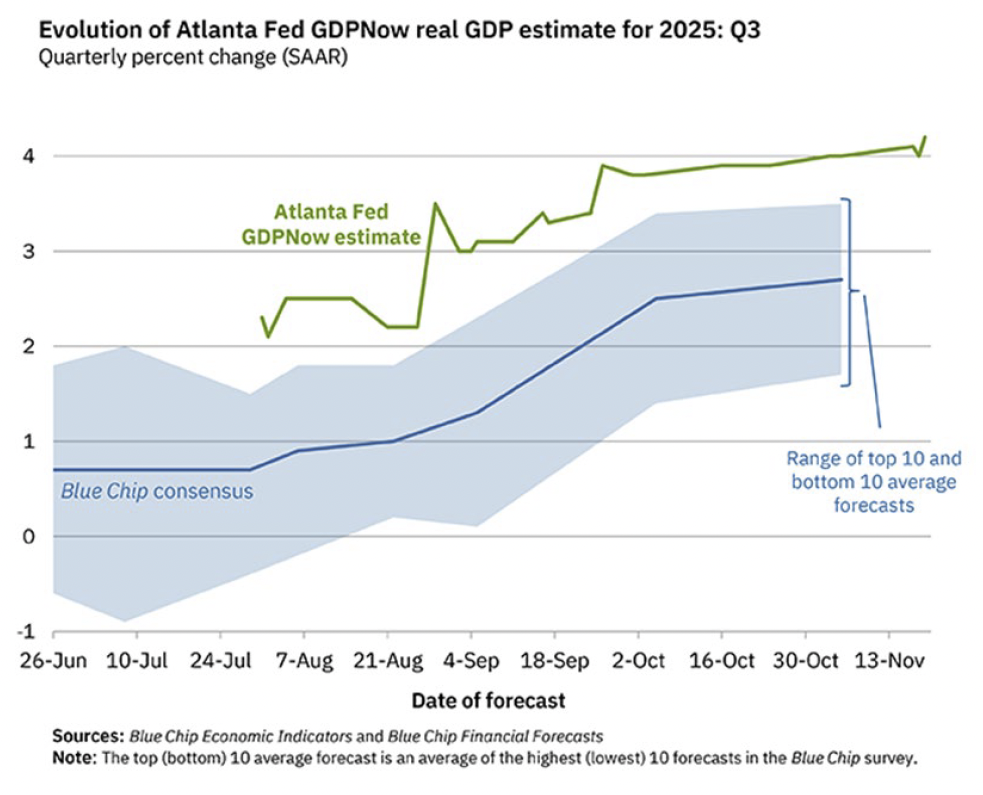
First, the economic outlook continues to exceed expectations as show by the rising green line built on data steadily running above the rising blue line built on economist forecasts (read: soft opinions from people that go on financial media and wring their hands about things to worry about that may or may not be showing up in the hard data).

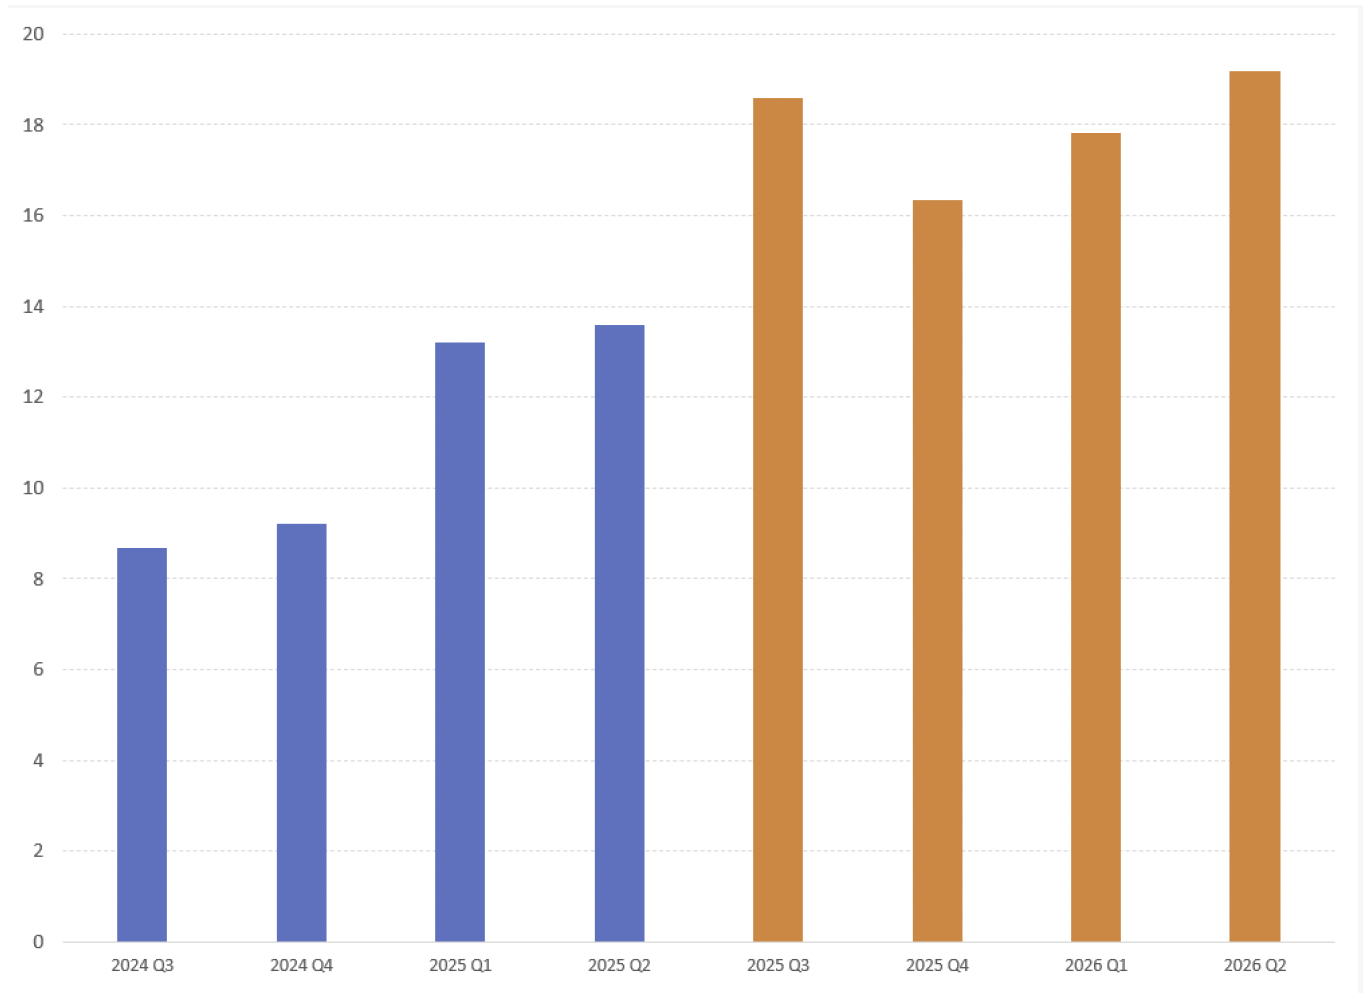
Second, corporate earnings growth needs to be trending lower if not outright declining before stocks are ready to fall into a sustained decline. The importance of corporate earnings growth on stock prices cannot be overstated, as the correlation between stock prices and corporate earnings growth is very high over the past 155 years. And when looking at the chart below from S&P Global (keeper of the S&P 500) that shows the annual GAAP earnings growth (%) on the S&P 500 for history (blue bars 2024 Q3 to 2025 Q2) and forecast (orange bars 2025 Q3 to 2026 Q2), we see bars that are steadily rising, not falling, into the high teens. This robust rate of current and expected earnings growth would need to at least begin to show signs of cooling off before we would start to become concerned about a sustained market correction or pending bear market if more than 150 years of history is any guide.

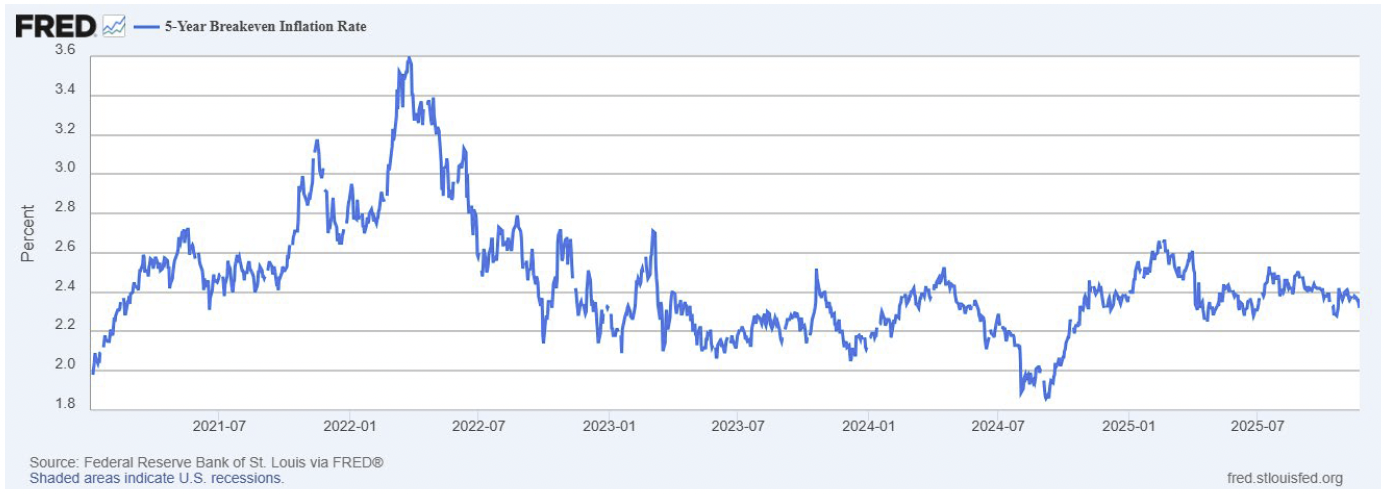
Third, inflation expectations remain fully in check. I’ve been chirping since the summer of 2023 that the primary downside risk to capital markets including stocks has been and continues to be a renewed rise in inflation. And while I can sit here all day and talk about the reasons why we may see a renewed rise in inflation in 2026 and beyond over the next decade that may eventually come to pass (see September 2021 and the months that followed on the chart below), the reality remains that while inflation is now sustainably higher than it was before COVID, expectations about future inflation remain fully in check with the 5-year breakeven inflation rate (the average expected inflation according to the markets (hard data) drifting toward 2.3%.

Putting these three key fundamental points together, and the underlying conditions simply do not exist outside of an exogenous or idiosyncratic event to support a more sustained and prolonged move to the downside in stocks outside of the customary and healthy regression to the mean pullback within a continued uptrend.
Bleed on. Putting this all together, it may very well be that the market pullback that started back in late October may now be over. But if stocks continue to fall to the downside, investors should let it bleed and look sharp at key support levels for entry points if anything to loss harvest and buy dips on the margins as part of a continued broader uptrend in stocks as we head toward the New Year.
Disclosure: I/we have no stock, option or similar derivative position in any of the companies mentioned, and no plans to initiate any such positions within the next 72 hours. I wrote this article myself, and it expresses my own opinions. I am not receiving compensation for it. I have no business relationship with any company whose stock is mentioned in this article.
Investment advice offered through Great Valley Advisor Group (GVA), a Registered Investment Advisor. I am solely an investment advisor representative of Great Valley Advisor Group, and not affiliated with LPL Financial. Any opinions or views expressed by me are not those of LPL Financial. This is not intended to be used as tax or legal advice. All performance referenced is historical and is no guarantee of future results. All indices are unmanaged and may not be invested into directly. Please consult a tax or legal professional for specific information and advice.
LPL Compliance Tracking #830319.
